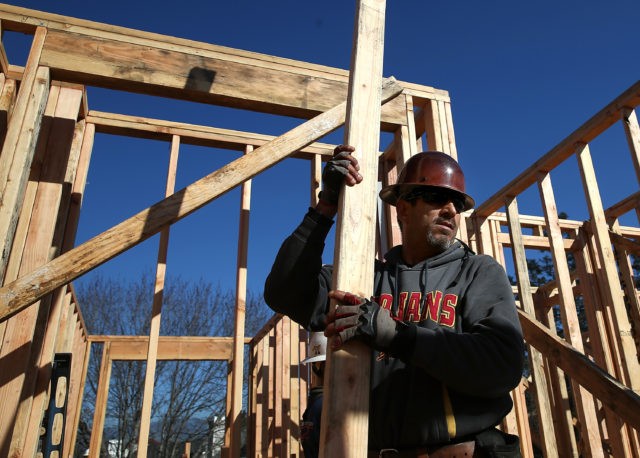
Home construction rebounded in July but was much weaker than expected.
Housing starts grew 0.9 percent in July from the prior month, far below the 8.3 percent rise economists had expected, according to data released Thursday. Homes were built at a seasonally adjusted annual rate of 1.168 million units.
New home construction is considered a leading indicator of the American economy, although it can be volatile month to month. It tends to reflect the health of America’s economy, with home builders providing more houses when household incomes are expected to rise. And new home construction creates jobs–both directly, in building trades, and indirectly through purchases of furniture and appliances.
So when home construction slows down, it may be predicting–or even causing–an economic slowdown to come. But with unemployment very low and other signs of economic growth pointing higher, this may simply be a weight that keeps the economy from overheating. That could allow the Federal Reserve to hold off on raising interest rates next year.
The disappointing July number comes after a shock in June, when new construction was reported to have dropped 12.9 percent in June. Now June construction looks to have been even lower than that, with revised data sinking to a 1.158 million-unit rate.
Some of the recent slowness may be due to unusually strong construction earlier in the year. May’s housing starts, for example, were at the highest level since 2007. In the first five months of the year, starts grew by 11 percent in the first five months of 2018. Multifamily starts were up 13.3 percent, while single-family starts grew 9.8 percent.
Over the long run, new home construction is tied to the growth of the number of households in the U.S. So a period in which home construction runs relatively hot–starts last year totaled 1.2 million, the most in a calendar year since 2007–should be followed by a slowdown. But for the first five months of 2018, the market continued to show year-over-year growth.
The chart below compares the annual growth of households with the number of new homes going back all the way to 1960. And it shows a strong relationship between new home construction and growth in the number of households. (Those big spikes in the household figures are around the official Census numbers every ten years.)
If we zoom in to the last five years, however, we see that home building has continued to grow while the growth of households has declined.
Economists, who generally think that we should be averaging around 1.2 million housing starts a year, may have not taken into account the decline in the growth of households. If the decline continues this year, new home construction should fall even further.
There also appears to be a bit of evidence of regional rotation. Construction grew in the South and Midwest in July, while falling in the Northeast and the West. A month ago, Midwest starts plunged the most.
Home builders say rising material and land costs and labor shortages are making it new construction more difficult and driving up prices. Higher interest rates also discourage building by raising the funding costs of builders and the cost of mortgage financing for homebuyers.
It is a bit strange that some builders say rising home prices, due to supply constraints, could be holding back construction. Rising prices typically encourage more building not yet.
Home-builder confidence fell in August, resuming a pattern of decline that has characterized the year. Home-builder confidence may actually be a trailing indicator, reflecting home builders’ recent experience. So August’s decline may just be a reflection of how slow June and July were for the business.

COMMENTS
Please let us know if you're having issues with commenting.