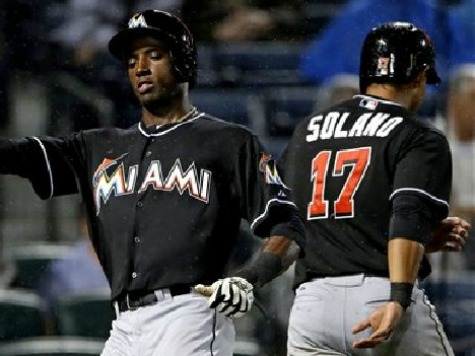
The Braves’ Jordan Walden’s pitch broke sharply under the glove of catcher Evan Gattis in the ninth inning, letting Adeiny Hechavarria race home to give the last place Marlins a 1-0 win to end the Braves 14-game winning streak. It was the first time the Braves have lost since Waffle House opened at Turner Field on July 26.
The chances of last beating first are less than 30 percent, but the chance of last beating first once in 15 games is about 99.4 percent.
Fans often express shock when a last place team beats a first place team, but in the course of a 162-game season, there are so many chances that it happens numerous times.The three hottest teams in baseball have all had long winning streaks, with the Dodgers winning 15 straight on the road, the Tigers winning 12 straight and now the Braves winning streak ending at 14, the second longest streak in Braves history.I’ve set up two simple tables that let you enter just two figures to calculate the chances of one team beating another in any sport:
| Column A | Column B | Column C | |
|---|---|---|---|
| 1 | Enter Team A Win% | 1-A1 | |
| 2 | Enter Team B Losing% | 1-A2 | |
| 3 | A1*A2 | B1*B2 | A3/B3 = Team A Chance to win |
If you set up these formulas, the only numbers you need to enter to this table are the winning percentage of one team and the losing percentage of the other team. Obviously you will need to make common sense adjustments for injuries or other roster changes – for example the Marlins Ricky Nolasco beat the Braves back on July 3, but he is no longer with the Marlins.In baseball, you also need to adjust for which pitchers are starting. However, as a starting point, if we simply enter that the Braves are a team with a .607 chance of winning (keep in mind this would be their percentage against a .500 team), and the Marlins are a team with a .617 losing percentage (.383 winning percentage) then you enter those numbers and get these results.
| Column A | Column B | Column C | |
|---|---|---|---|
| 1 | 0.607 | 0.393 | |
| 2 | 0.617 | 0.383 | |
| 3 | 0.374519 | 0.150519 | 71.3% |
We see that on any given day this season, the Braves would have a 71.3% chance of beating the Marlins, so there was only a 28.7% chance of the Marlins winning last night in the most general terms.Then we get to the more incredible part of these three streaks. Even if the Braves, Dodgers and Tigers all had .607 winning percentages, and they all got to play a team as bad as the Marlins every game (.613 losing percentage), what are the chances of their winning streaks?
If they have a 71.3% chance of beating the last-place team once, then you barely have a 50-50 chance of beating them twice in a row (71.3% x 71.3% for the chances of winning twice in a row, similar to the chances of rolling a 3,4,5 or 6 twice in a row with a die). Even sweeping a series is very difficult, as the Braves would have only a 36.2% chance of sweeping a three-game series (71.3% x 71.3% x 71.3%).The chances of beating a variety of teams 12, 14 or 15 times in a row is much lower, but the table below shows that even if they were able to play the worst team in the league every day, the Tigers would have had only a 1.7% chance of winning 12 straight, the Braves had only a 0.9% chance of winning 14 straight, the Dodgers had only a 0.6% chance of winning 15 straight.
The the Oakland A’s had only a 0.1% chance of winning 20 straight when Billy Beane pulled that off 11 years ago to point all of baseball’s attention to what could be accomplished even on a small payroll if executives were willing to be guided by stats. Here are the chances of various winning streaks even if the best team in the league played the worst team in the league every game.
| Chance of | Winning streak of: |
|---|---|
| 71.3% | 1 |
| 50.8% | 2 |
| 36.2% | 3 |
| 25.8% | 4 |
| 18.4% | 5 |
| 13.1% | 6 |
| 9.4% | 7 |
| 6.7% | 8 |
| 4.8% | 9 |
| 3.4% | 10 |
| 2.4% | 11 |
| 1.7% | 12 |
| 1.2% | 13 |
| 0.9% | 14 |
| 0.6% | 15 |
| 0.4% | 16 |
| 0.3% | 17 |
| 0.2% | 18 |
| 0.2% | 19 |
| 0.1% | 20 |

COMMENTS
Please let us know if you're having issues with commenting.