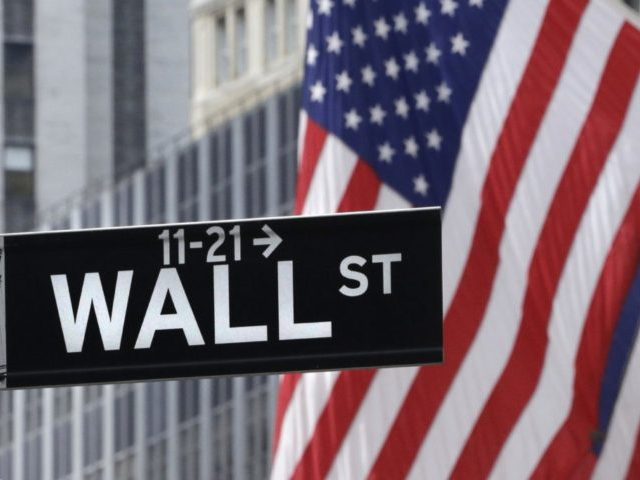
The stock market suffered its seventh consecutive daily loss on November 2, just one day less than the eight-day consecutive loss that launched the Financial Crisis in October 2008.
The U.S. stock markets are down just 4.21 percent from their all-time-high on August 15, 2016. Facing rising interest rates and extended stock valuations, technical traders called a sell signal on October 17 when the market’s “intermediate upturn” trend line was broken.
From the Financial Crisis stock market bottom in March 2009, the Standard & Poor’s Stock Index compounded over the next 7.6 years at a positive rate of 14.7 percent. That is over 5 percent greater than the 9.5 percent average annual return for the Index since 1928.
The last seven-consecutive-day decline was in November 2011, when markets fell by 7.8 percent. The Index recovered soon after, and more than double in the next 5 years.
During this period of one of the best all-time stock market performances, the yield on U.S. government 10-year bonds was slashed by about 60 percent, from 3 percent to 1.2 percent, due to the U.S. Federal Reserve’s “interest rate suppression” strategy.
Unable to meet their survival needs on such low bond yields and even lower bank CD rates, many American seniors have now moved their savings into the stock market, hoping for high returns. But such investors usually tend to panic during major stock market down moves.
Technician Lance Roberts of Real Investment Advice network uses a measure of volatility, called the VIX, as a “fear gauge,” to try to understand the investor psychology that tends to swing from greed, to fear, and then back to greed. A VIX of 10 or below indicates that investors are extremely optimistic, and a reading of 20 or above indicates heightened pessimism.
Over the last 4 years, the VIX has averaged about 14, which is a sustained period of investor confidence. But in the last 3 months, the daily stock market movements have become highly erratic, both up and down. In the last seven-day sell-off, the VIX “fear gauge” rose to 19.34 on November 2, approaching the scary point where investors may panic.
After such a huge over-performance in the run-up in stock prices, Roberts is concerned that there is substantial risk of an over-performance on the down side. He suggests that this could be intensified if the U.S. Federal Reserve is about to start raising interest rates.
Roberts advises that stock market risk appears “elevated,” and that investors should underweight equity ownership. This is Wall Street speak for “Duck and Cover!”

COMMENTS
Please let us know if you're having issues with commenting.